Full experiment report
Rollout-1 guidance experiments
Results from September 2–4, 2026, reevaluated with the original repository's rollout-1 and rollout-5 metrics. Every error value in the tables and figures below uses that evaluation. Ball validity is reported separately.
The early five-video experiment improved ball validity but slightly worsened average original rollout error. Direct guidance then improved both original metrics on the tuned Case 2 generation. Larger update budgets did not help, while several nearby settings improved on the historically selected configuration. The later ten-video experiment, which used a 75-update cap, worsened both original metrics on every video at each active guidance step count.
1. Evaluation and experimental scope
These experiments generate 49-frame, five-ball videos, conditioned on the first five frames, using the same bidirectional diffusion checkpoint. The detailed parameter sweep uses Case 2, 00000/828.mp4, generation seed 0, and 50 denoising steps. Its tie-breaking seed tests vary the choice between equally scored guidance sources; they keep the video and generation seed fixed.
The original repository reconstructs the generated trajectory with Simulation.from_video. For each evaluated target frame, it simulates forward from one or five video frames earlier and compares the predicted and reconstructed ball centers. Rollout-1 and rollout-5 are the mean Euclidean distances over frames 5–48 and all five balls, in the simulator's 10-by-10 world coordinates. They measure physical consistency within the generated video.
The calculation is Difference.from_simulations(sim_out, rollout(sim_out, horizon=h)).avg_center_error((5, None)), with h=1 or h=5. It uses the original tracker and adds no world-diagonal penalty. See the evaluation code and rollout implementation.
The separate scorable-transitions counts come from the newer tracker saved with the experiments. Complete coverage is 44 future frames × 5 balls = 220. Missing, wrong-color, or extra balls and unavailable source states reduce this count. These counts describe validity; they do not weight or filter the original rollout errors.
During the experiments, guidance selection and the recorded success gate used a different, validity-aware score. The historical selection decisions refer to that score. This report reevaluates the resulting videos with the original metrics, so the rankings below can differ from the historical rankings. The old success thresholds are not applied to these new values.
2. The five-video pilot improved validity, but not average original error
The initial method operated during denoising steps 40–49. It selected the valid source frame with the largest guidance error, built a reference with only the next frame replaced by a physics prediction, and tried strengths 0.1, 0.03, 0.01, and 0.003. It accepted a proposal only when the experiment's validity-aware score improved, allowing at most 12 accepted updates per denoising step.
Reevaluation of the saved outputs gives:
| Case | Source video | Rollout-1 vanilla | Rollout-1 guided | Rollout-5 vanilla | Rollout-5 guided | Accepted updates |
|---|---|---|---|---|---|---|
| 1 | 00000/164.mp4 |
0.3482 | 0.3936 | 1.2995 | 1.3559 | 20 |
| 2 | 00000/828.mp4 |
0.4316 | 0.4266 | 1.4111 | 1.5294 | 37 |
| 3 | 00000/037.mp4 |
0.3653 | 0.3713 | 1.2368 | 1.3090 | 22 |
| 4 | 00000/871.mp4 |
0.4763 | 0.4928 | 1.4566 | 1.4703 | 20 |
| 5 | 00000/066.mp4 |
0.5053 | 0.4815 | 1.6778 | 1.8373 | 18 |
| Mean / total | 0.4253 | 0.4332 | 1.4163 | 1.5004 | 117 |
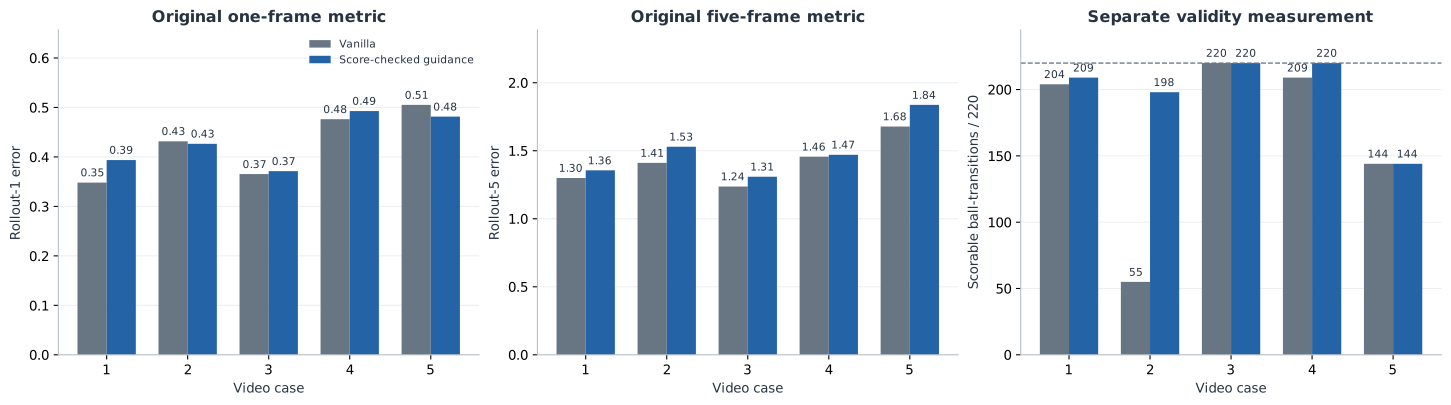
Original rollout-1 improved on 2/5 videos; rollout-5 improved on 0/5. Scorable transitions nevertheless increased from 832 to 991 out of 1,100. The validity gain and the original error measurements therefore give different assessments of this pilot.
The tracker was subsequently revised to retain every detected ball before identity matching. A separate Case 2 rerun accepted 26 updates and retained 204/220 scorable transitions. Its original rollout-1/rollout-5 errors were 0.4203/1.3926, versus 0.4316/1.4111 for its control. This rerun improved both original errors slightly and still lacked complete validity.
Sources: reevaluated five-video results, saved experiment metadata, interactive pilot report (out/guidance/guidance-experiments-report/rollout1-single-source-guidance.html).
3. Direct guidance improved the tuned Case 2 generation
The extensive sweep changed the procedure. At each active denoising step, it set a threshold from the initial minimum source error. It repeatedly selected the smallest error still above that threshold, formed a one-frame physics target, and applied the gradient directly, without proposal acceptance or rollback. Source selection, update policy, and budget changed together.
The early runs tested guidance strength, thresholds, start/end steps, update counts, and whether to restrict updates to the target's latent time slice. Thirteen early runs retain their configurations and validity evaluations, but their final videos are absent. Their original rollout errors cannot be reconstructed from the saved newer-metric summaries. The run inventory leaves those original-error entries blank.
Further tuning selected h1-run-29-sqrt-start0p7 in the historical report. Its video survives, and its configuration was:
| Component | Setting |
|---|---|
| Active denoising steps | 25–49, inclusive; indices start at zero |
| Update budget | 50 per active step; 1,250 total |
| Strength | Linear decay from 0.70 to 0.20 |
| Correction magnitude | Strength × square root of latent loss, with an RMS-normalized gradient and denoising step size |
| Source threshold | 0.5 × the step's initial minimum source error, floored at 10⁻⁶ |
| Source revisiting | Repeated minimum-error selection above the threshold |
| Gradient | Through the denoiser, updating all future latent slices |
| Guidance loss | Encoded-latent target built from a detected-ball redraw |
| Case 2 result | Original rollout-1 | Original rollout-5 | Scorable / 220 |
|---|---|---|---|
| Vanilla control | 0.4316 | 1.4111 | 55 |
| Historically selected cap-50 run | 0.3655 | 1.2949 | 220 |
This is a 15.3% reduction in rollout-1 and an 8.2% reduction in rollout-5, alongside restored validity. No missing, wrong-color, or extra balls were detected in the selected run.
The lower mean did not imply uniformly smaller errors. Under the original rollout-1 calculation, p95 fell from 1.1887 to 1.0234, while maximum error rose from 2.6335 to 3.1458.
“Historically selected” identifies the run retained by the earlier investigation. It is not a claim that this configuration minimizes the original metrics across all subsequent tests.
Sources: original scores and provenance, historical Case 2 report (out/guidance/guidance-experiments-report/rollout-smallest-error-results-so-far.html), selected video.
4. Larger update budgets did not help; nearby caps traded error against validity
The budget comparison held the selected settings fixed and changed the allowed updates per denoising step. The original-metric results are:
| Cap per step | Total updates | Rollout-1 | Rollout-5 | Scorable / 220 |
|---|---|---|---|---|
| 48 | 1,200 | 0.6205 | 1.7344 | 163 |
| 49 | 1,225 | 0.4530 | 1.2526 | 189 |
| 50 | 1,250 | 0.3655 | 1.2949 | 220 |
| 51 | 1,275 | 0.3483 | 1.2362 | 214 |
| 75 | 1,875 | 0.4239 | 1.3901 | 207 |
| 100 | 2,500 | 0.4423 | 1.5622 | 214 |
| 200 | 5,000 | 0.5199 | 1.7377 | 204 |
| 500 | 12,500 | 0.4852 | 1.7596 | 167 |
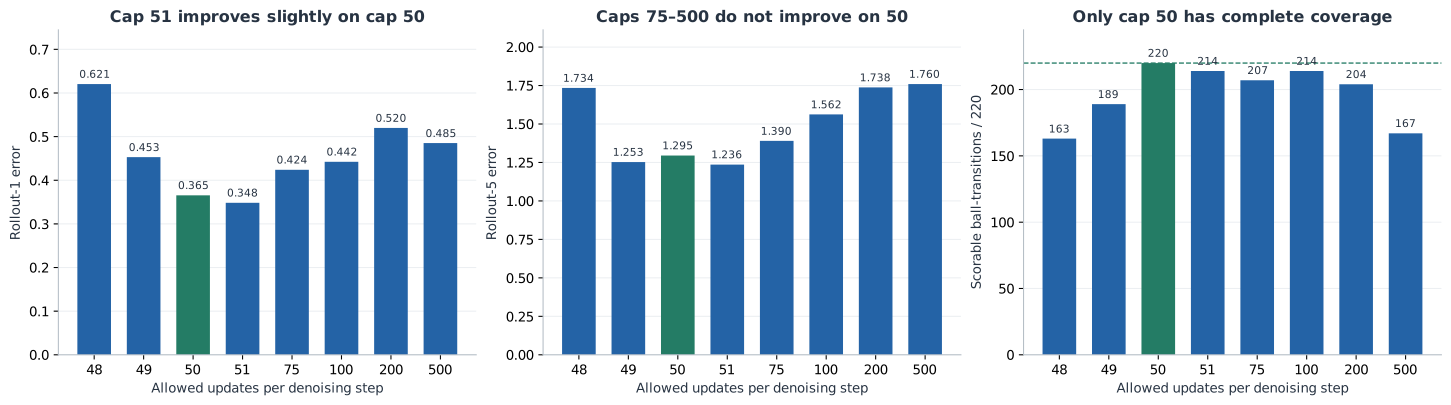
Green marks the historically selected cap 50. Every cap from 75 through 500 worsened both original errors. Cap 51 improved both errors slightly, but reduced coverage to 214/220. Cap 49 improved rollout-5 while worsening rollout-1 and validity.
Cap 500 used ten times as many updates as cap 50 and worsened both error metrics. Increasing the budget was not sufficient to improve this configuration.
Sources: cap comparison with source paths, 75-update configuration, 500-update configuration.
5. Some nearby settings improve the original metrics without losing validity
The final batch contained 21 completed generations: six tie-breaking seeds, three earlier stopping points, nine changes to the final step's strength, and the three nearby update caps above. All 21 videos survive and have been rescored with both original metrics.
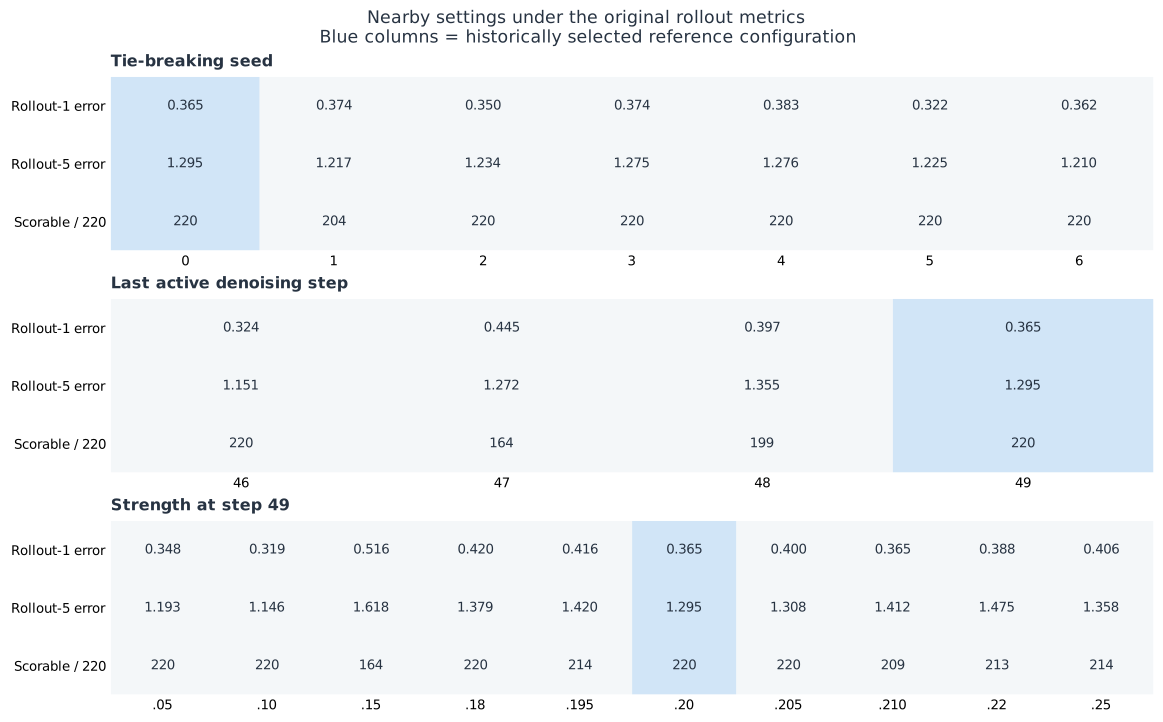
Blue columns show the historical reference: seed 0, final active step 49, and step-49 strength 0.20. These are measured values, not pass/fail classifications under the old success gate.
Several variants improved on the reference while retaining all 220 scorable transitions:
| Setting | Rollout-1 | Rollout-5 | Scorable / 220 |
|---|---|---|---|
| Historical reference | 0.3655 | 1.2949 | 220 |
| Step-49 strength 0.10 | 0.3195 | 1.1459 | 220 |
| Tie-breaking seed 5 | 0.3221 | 1.2252 | 220 |
| Stop guidance after step 46 | 0.3244 | 1.1513 | 220 |
| Step-49 strength 0.05 | 0.3476 | 1.1927 | 220 |
Step-49 strength 0.10 has the lowest original rollout-1 and rollout-5 errors among the 21 final-batch variants. It changes only the final step's strength. Ending guidance at step 46 also helps both original metrics; those saved configurations adjust the strength endpoint to preserve the intended earlier schedule.
The historical report recorded no full success under its own validity-aware error thresholds. Reevaluation with the original metrics gives a different ranking: the reference is beaten by several nearby settings, including settings with complete validity. These are all still results on the same Case 2 generation.
Sources: final-batch scores and configurations, historical archive description.
6. Update behavior and alternative guidance losses
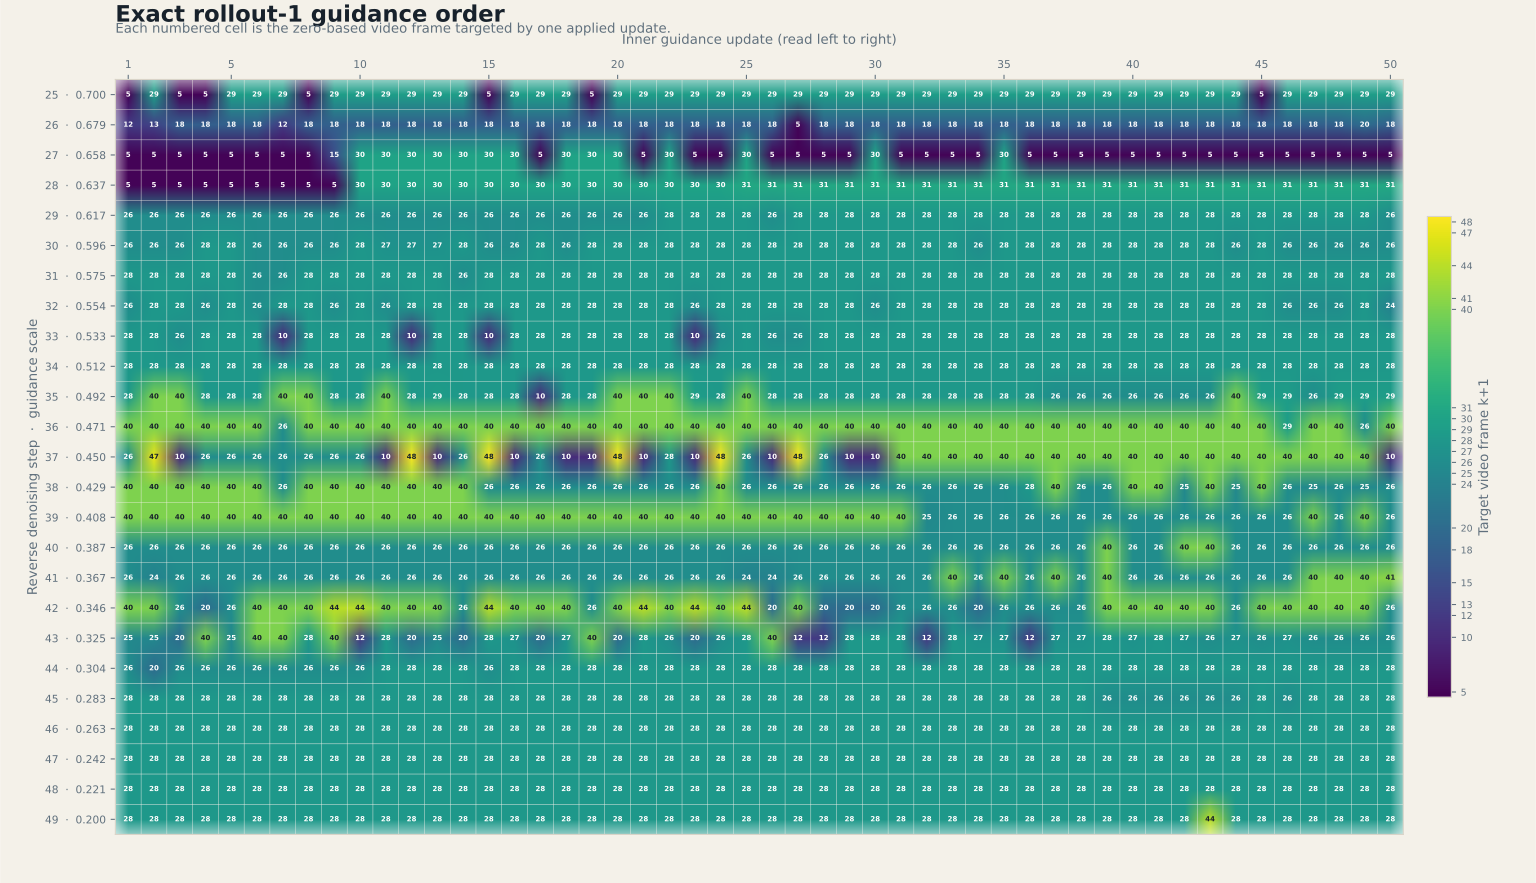
The saved trace shows how the selected configuration spent its 1,250 updates:
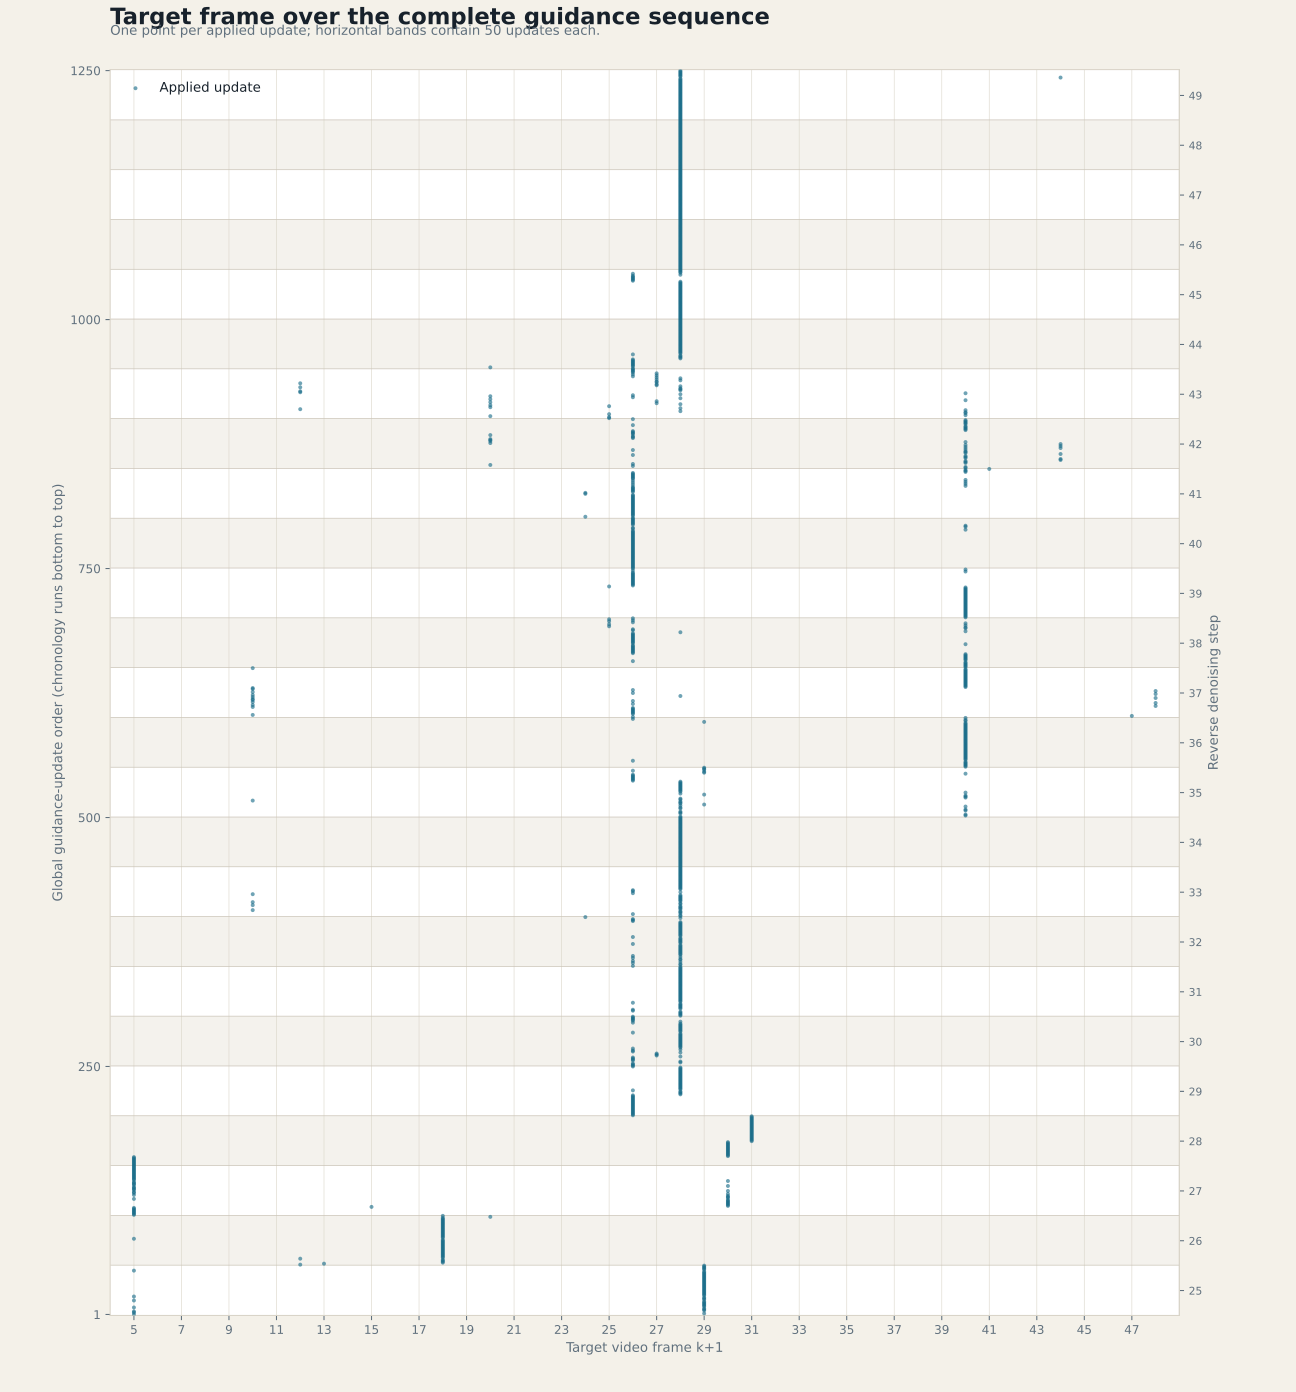
Horizontal position identifies the target video frame; vertical position gives cumulative update order. Each band contains one denoising step's 50 updates. The method repeatedly revisits target frames. The exact per-step matrix records every target index.
A separate update audit in the historical report evaluated the guide's own local physics error. It decreased on 44.9% of all updates, or 52.0% of updates where the same source remained measurable. These are diagnostics of the guidance procedure, not the original final-video rollout scores plotted here.
The investigation also changed the guidance loss and target construction:
| Variant | Recorded full-generation result |
|---|---|
| Decoded-pixel loss | All three runs lost ball validity |
| Decoded color-moment loss | The three runs retained only 144–149/220 scorable transitions |
| Current decoded video as the reference for unchanged frames | The three runs retained 60, 134, and 138/220 scorable transitions |
The original report preserves these outcomes and records 66 full horizon-1 generations across the direct-update investigation. The alternative-loss videos are not in the surviving archive used for this reevaluation, so no original rollout scores are assigned to them.
Source: historical diagnostics and variant results (out/guidance/guidance-experiments-report/rollout-smallest-error-results-so-far.html).
7. The ten-video follow-up worsened both original metrics
On September 4, one direct-update configuration was run on 10 videos × 5 denoising-step counts: 10, 20, 50, 100, and 200.
This experiment used cap 75, strength 0.70 → 0.20, and absolute start step 25. It therefore differs from both the historical cap-50 reference and the better final-step-strength variants above. The launcher replayed the corresponding baseline batch's noise position for each video.
The 10- and 20-step runs applied zero guidance updates, because they never reached step 25. Their scores are retained in the data tables. Their differences from saved controls cannot be attributed to guidance.
For the three active step counts:
| Denoising steps | Updates per video | Rollout-1 vanilla | Rollout-1 guided | Rollout-5 vanilla | Rollout-5 guided | Videos improved, either metric |
|---|---|---|---|---|---|---|
| 50 | 1,875 | 0.2317 | 0.6175 | 0.9368 | 1.8875 | 0/10 |
| 100 | 5,580–5,625 | 0.2159 | 0.5980 | 0.8823 | 1.8098 | 0/10 |
| 200 | 13,125 | 0.2387 | 0.5516 | 0.9035 | 1.7335 | 0/10 |
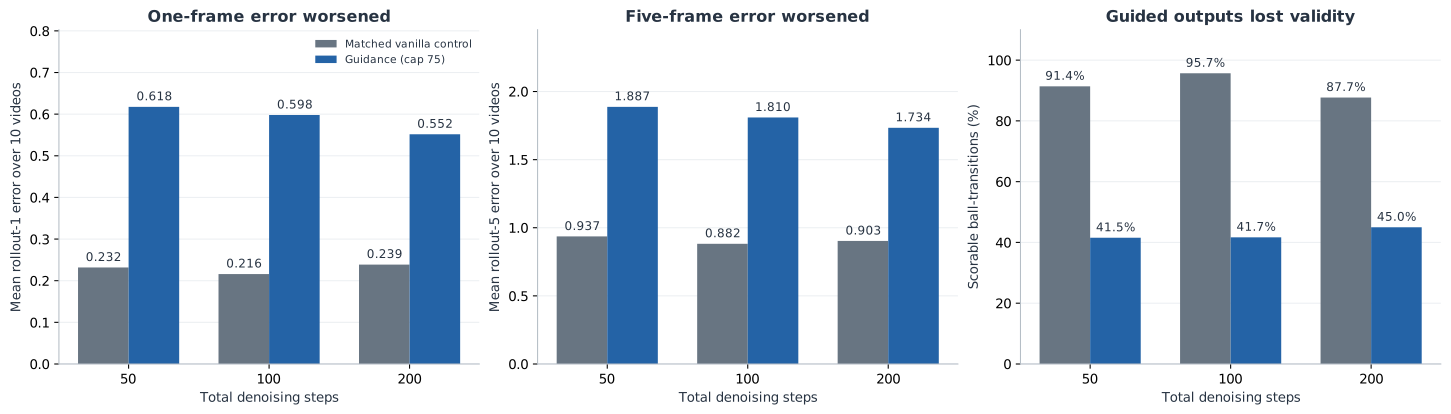
Each mean weights the ten videos equally. Guided coverage was 914/2,200, 917/2,200, and 990/2,200 at 50, 100, and 200 steps: 41.5%, 41.7%, and 45.0%. The corresponding controls had 91.4%, 95.7%, and 87.7% coverage.
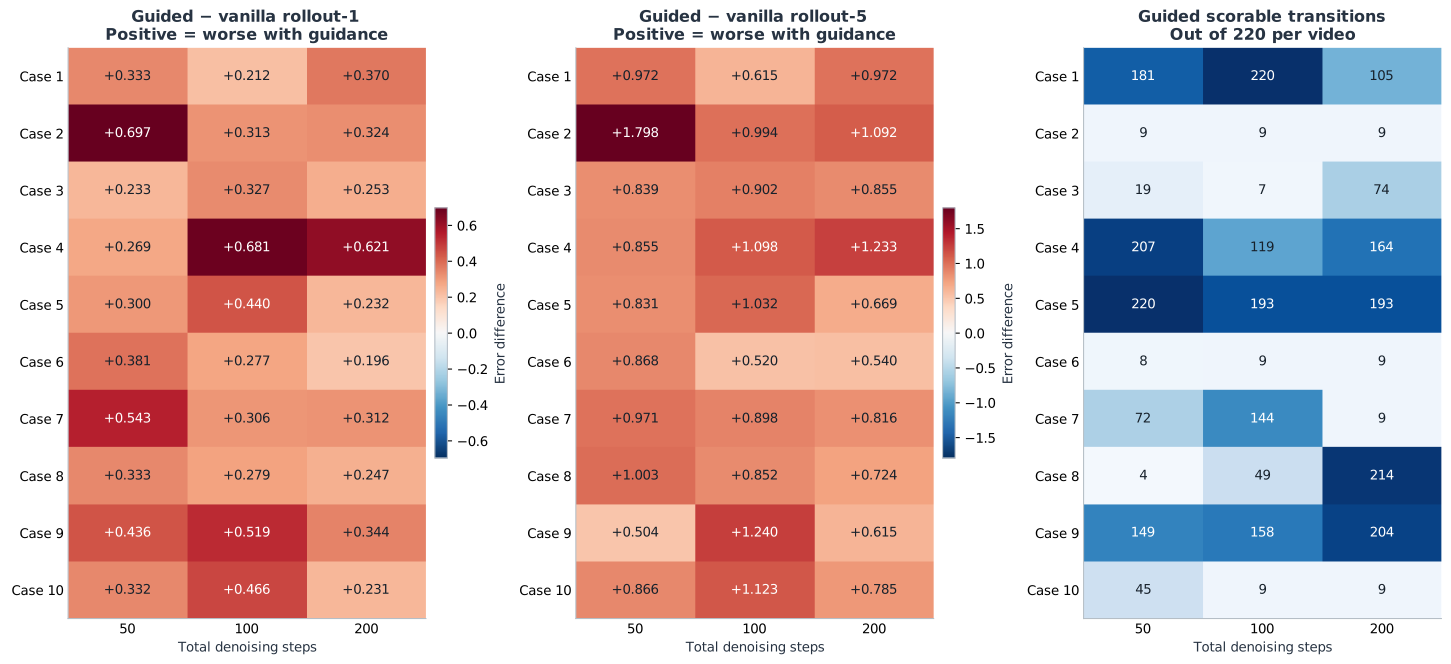
Every guided output has higher original rollout-1 and rollout-5 error than its corresponding control at each active step count. The two error panels use their own color scales. The right-hand panel gives separate validity counts.
The Case 2 follow-up also uses a different noise realization from the single-video sweep, despite both recording seed 0: it replays position 1 of a 112-sample baseline batch. Its 50-step vanilla control scores 0.1647/0.6973 on original rollout-1/rollout-5, versus 0.4316/1.4111 for the sweep's control. These are different generated controls.
This follow-up establishes poor performance for the tested cap-75 configuration. It does not test the cap-50 configuration with step-49 strength 0.10 across ten videos.
Sources: per-video results, aggregate results, launcher, Case 2 follow-up configuration.
8. Saved-video comparison
The following frames show the same Case 2 input at five fixed video-frame indices. The sweep's cap-50 output retains the five colors in these frames; cap 500 shows a changed color at the end. The follow-up has a different vanilla control and its own cap-75 output.
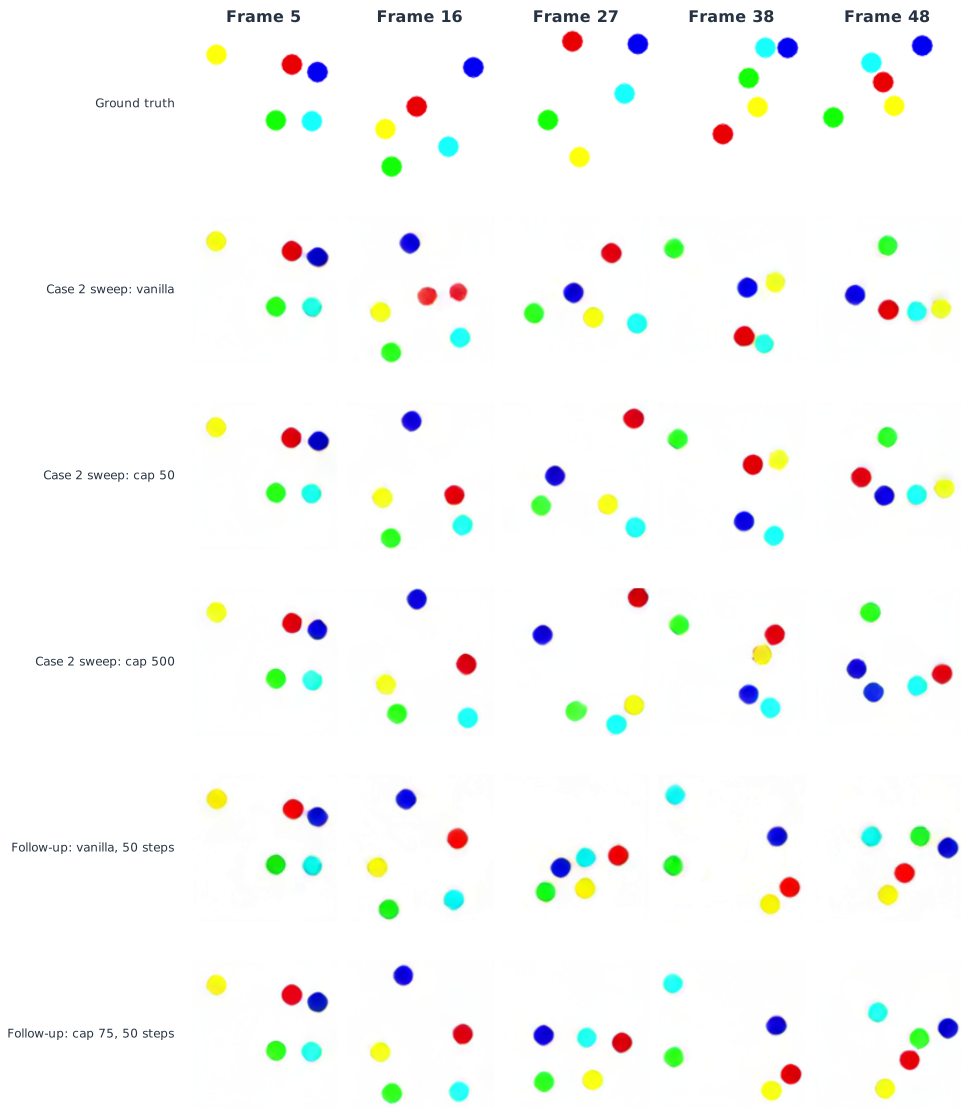
Frames 5, 16, 27, 38, and 48, indexed from zero. These are decoded frames from saved MP4s. The error metrics above cover all evaluated future frames.
Full videos: historical cap 50, step-49 strength 0.10, cap 500, follow-up Case 2 at 50 steps.
Data and reproduction
Both original metrics were recomputed for 140 saved video files, including experiment outputs, controls, and the Case 2 ground truth. Each metric was checked against 50 stored original-metric baseline evaluations. Maximum absolute differences were 1.1 × 10⁻⁸ for rollout-1 and 2.2 × 10⁻⁶ for rollout-5.
The six new figures use these original scores and separate saved validity counts. The guidance-order figure is reused from the historical report. No new videos were generated.
- Original scores and provenance: per-video means, p95/max values, video hashes, implementation hashes, and validation.
- Figure data, pilot results, and cap comparison.
- Case 2 inventory: original scores for the 21 final-batch videos; configurations and validity for 13 earlier runs whose videos are absent.
- Ten-video results and aggregates.
- Recompute scores with score_original_rollouts.py, then rebuild figures and tables with build_figures.py:
python out/guidance/rollout1-report-assets/score_original_rollouts.py, followed bypython out/guidance/rollout1-report-assets/build_figures.py.